Univariate Data Generation
Here, we generate example data for a univariate function \(f(x)\). First, the class univariate_examples is loaded.
[1]:
from insidapy.simulate.univariate import univariate_examples
Then, we instantiate the class using the built-in examples. The number of runs and points per profile, the time span, and the noise addition method can be chosen.
[2]:
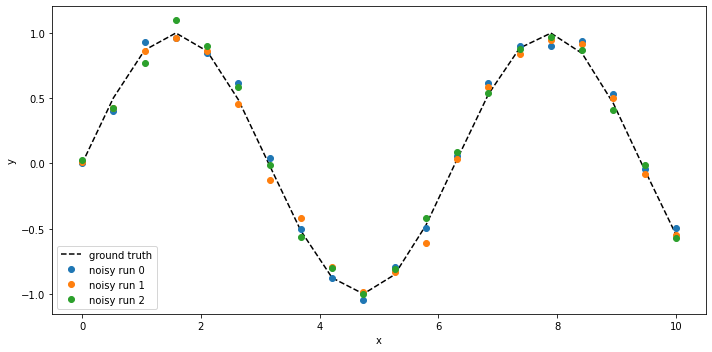
univariatedata = univariate_examples(example='sin',
                                     nruns=3,
                                     npoints=20,
                                     tspan=[0,10],
                                     noise_mode='percentage',
                                     noise_percentage=10,
                                     seed=None) # numy random seed is set to None by default
Last, the produced data can be visualized using the plot method. We can save the figure using a path (save_figure_directory), a name (figname) and an some extensions (save_figure_exensions) as a list. By using show=False, the plot will not be displayed in a running code.
[3]:
univariatedata.plot(show=True,
                    save=True,
                    figname='univariate_example',
                    save_figure_directory='./figures',
                    save_figure_exensions=['png'])
[+] Saving figure:
        ->png: ./figures\univariate_example.png
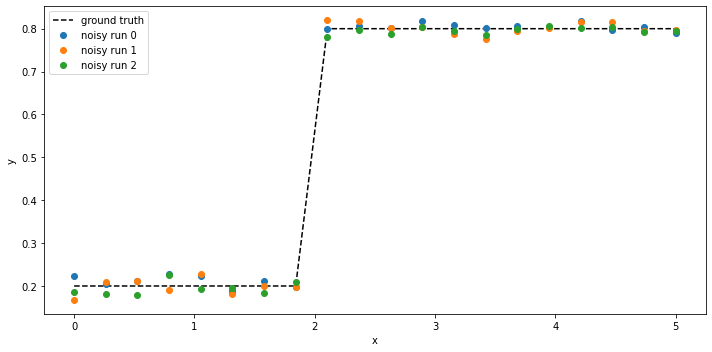
There are many other functions available for generating such univariate profiles. Another example is the step function. This function requires some additional inputs (i.e., where the step is located on the x-axis using the step_pos, and what the values before and after the step should be, using x_min and x_max). If the user does not indicate those inputs, the default values are chosen and the user is informed about it via the console:
[4]:
univariatestep = univariate_examples(example='step',
                                     example_args={'step_pos': 2, 'x_min': 0.2, 'x_max': 0.8},
                                     nruns=3,
                                     npoints=20,
                                     tspan=[0,5],
                                     noise_mode='percentage',
                                     noise_percentage=2,
                                     seed=0)

univariatestep.plot(show=True,
                    save=True,
                    figname='univariate_example_step',
                    save_figure_directory='./figures',
                    save_figure_exensions=['png'])
[!] Numpy random seed was fixed by user (seed=0)!
[+] Saving figure:
        ->png: ./figures\univariate_example_step.png
We can now also split the runs into training and testing, if required:
[5]:
univariatestep.train_test_split(test_splitratio=0.2)
Last, we can export the data to excel. In case we did not do a train-test-split, we can use the keyword which_dataset=all or just leave it empty (it is the default):
[6]:
univariatestep.export_to_excel(destination='./data', which_dataset='all')
[+] Exported batch data to excel.
        -> Dataset: ALL (options: training, testing, all)
        -> Noise free data to: ./data/univariate_step_all.xlsx
        -> Noisy data to: ./data/univariate_step_all_noisy.xlsx